If you’ve run your store through a speed test, you’ve probably stared at a number between 0 and 100 and wondered: is that good? Should I be worried? This guide explains what a good Shopify speed score actually is, where the number comes from, and — more importantly — what it means for your sales.
Where your Shopify speed score comes from
There are two different “speed scores” merchants run into, and they don’t mean the same thing.
1. Shopify’s online store speed report. Found in your admin under Online Store → Themes, this gives you a single score based on Google Lighthouse, averaged across your homepage, a product page, and a collection page. It’s a useful directional signal, but it updates infrequently and only reflects a handful of pages.
2. Google PageSpeed Insights / Lighthouse. Run any URL through PageSpeed Insights and you get a 0–100 score for that specific page, on both mobile and desktop, plus the underlying Core Web Vitals. This is the score Google itself uses signals from for ranking, so it’s the one worth focusing on.
Important: Always check your mobile score first. Most Shopify traffic is mobile, and Google uses mobile-first indexing. Mobile scores are almost always lower than desktop — don’t be alarmed by the gap.
What counts as a good score
Google groups scores into three bands:
| Score | Rating | What it means |
|---|---|---|
| 90–100 | Good | Your store is fast |
| 50–89 | Needs Improvement | There’s room to optimize |
| 0–49 | Poor | Speed is likely hurting conversions |
Here’s the honest reality, though: most real Shopify stores score between 40 and 70 on mobile. A fully featured store with apps, tracking scripts, and rich product pages will struggle to hit 90+ on mobile. That doesn’t mean it’s broken.
So a practical, realistic target looks like this:
- 70+ on mobile — you’re ahead of the vast majority of Shopify stores.
- 90+ on desktop — very achievable and a reasonable goal.
- Anything under 40 on mobile — worth treating as urgent; it’s almost certainly costing you sales.
Chase steady improvement, not a perfect 100. Going from 35 to 60 matters far more than agonizing over the last few points to reach 95.
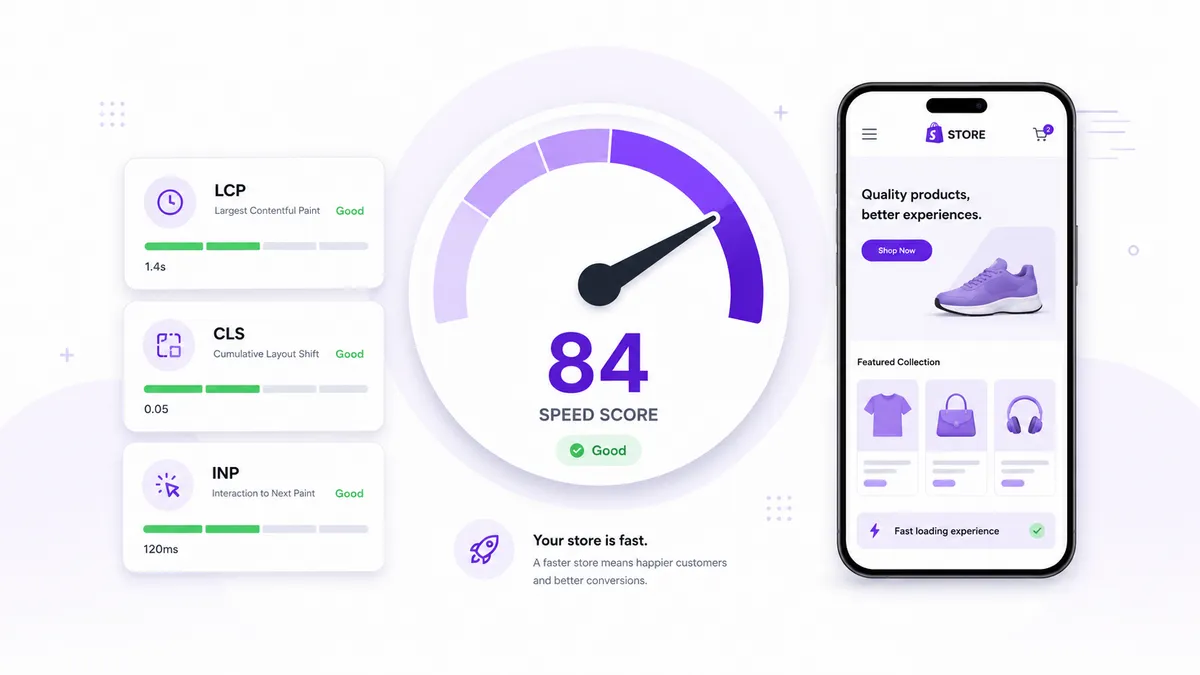
The score is a proxy — Core Web Vitals are the real metrics
The single number is just a summary. Underneath it sit the metrics that actually describe what your visitors experience:
- Largest Contentful Paint (LCP) — how long until the main content (usually your hero image or headline) appears. Aim for under 2.5 seconds. This is the most important one.
- Cumulative Layout Shift (CLS) — how much the page jumps around as it loads. Aim for under 0.1. Images without dimensions and late-loading fonts are common culprits.
- Interaction to Next Paint (INP) — how quickly the store responds when someone taps or clicks. Aim for under 200 milliseconds.
If your score is low, these three tell you why. A bad LCP points to oversized images or render-blocking resources; a bad CLS points to layout instability; a bad INP points to heavy JavaScript.
Lab data vs. field data: why your score keeps changing
One thing that confuses a lot of merchants: run the same page twice and the score moves. That’s normal. PageSpeed Insights shows two kinds of data:
- Lab data — a single simulated test on a throttled connection. Reproducible-ish, but synthetic, and it bounces around.
- Field data (CrUX) — real measurements from actual Chrome users over the past 28 days. This is what reflects your real customers, and it’s what Google leans on for ranking.
If your lab score swings but your field data is stable, trust the field data. If you have no field data yet, your store simply doesn’t have enough traffic for Google to collect it.
What the number actually means for your store
It’s tempting to treat the score as the goal. It isn’t. Nobody has ever bought a product because your score went from 40 to 70. Speed matters for one reason: conversions. Every second of load time either moves a shopper toward checkout or gives them a reason to leave.
So reframe the question. Instead of “how do I get a higher score,” ask “what is making my store feel slow to the person trying to give me money?” The score is just the tool that points you at the answer.
How to check — and keep checking — your score
You’ve got two practical options:
- Manual: Run your key pages through Google PageSpeed Insights regularly, especially after installing a new app or changing your theme. New apps are the most common cause of a score quietly dropping.
- Automated: ThemeLens gives you a health score directly in your Shopify admin and breaks down exactly what’s pulling it down — heavy apps, render-blocking scripts, oversized images, leftover code — ranked by impact. It also monitors over time so you catch regressions before your customers do.
A good Shopify speed score isn’t a single magic number — it’s a realistic target (70+ mobile, 90+ desktop), healthy Core Web Vitals, and a store that keeps getting faster instead of slowly drifting slower.
Related reading
- Shopify Page Speed Optimization: The 5 Mistakes Slowing Down Your Store — a video walkthrough of the five most common speed killers.
- Step-by-Step Guide to Improve the Page Speed Score of Your Shopify Store — fix the issues dragging your score down, step by step.
- The Best Shopify Page Speed Apps — which type of speed app fits your store, and what to avoid.
- Phantom App Code: The Hidden Reason Your Shopify Store Is Slow — how to find and remove leftover code from uninstalled apps.
Want to see your store’s score and exactly what’s holding it back? Install ThemeLens — it’s free to start and gives you a clear, prioritized report in minutes. For a deeper walkthrough, see our step-by-step guide to improving your Shopify page speed.